
When the Gas System Fails
What pipeline disasters tell us about the buried risks of cheap heat

On September 13, 2018, about 4:00 p.m. local time, a series of structure fires and explosions occurred after high-pressure natural gas was released into a low-pressure natural gas distribution system in the northeast region of the Merrimack Valley in the Commonwealth of Massachusetts….The fires and explosions damaged 131 structures…Most of the damage occurred from fires ignited by natural gas-fueled appliances; several of the homes were destroyed by natural gas-fueled explosions.
—The National Transportation Safety Board’s Accident Report on Merrimack Valley, MA (2018)
Eight years ago, a gas-system disaster in Merrimack Valley, Massachusetts killed one person, injured dozens, damaged 131 structures, and shattered the implicit trust that surrounding communities had in the invisible network of pipes running beneath their feet. While uncommon, this event was not without precedent.
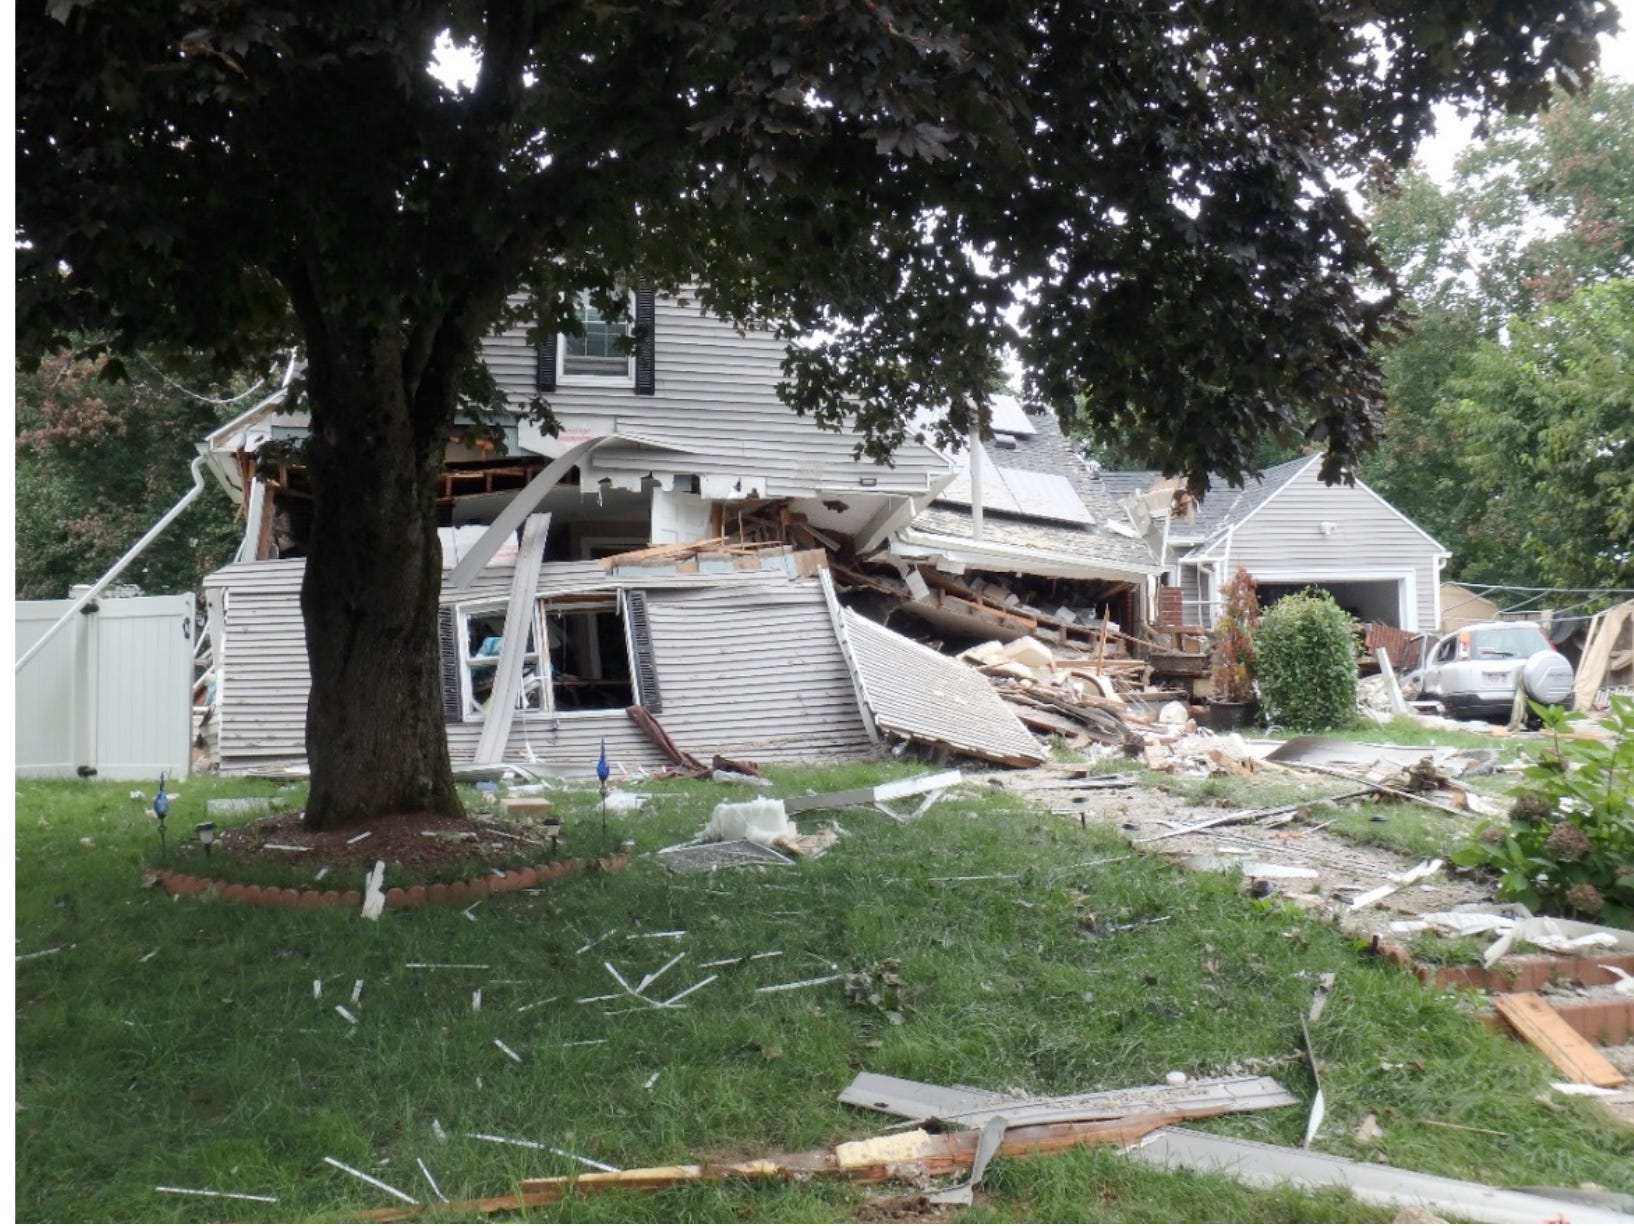
Above: Remnants of the house where the fatality and two severe injuries occurred (NTSB).
Disasters make it impossible to ignore the systems, infrastructures, and institutions we previously considered safe. Fixtures of daily life become spectacles. An explosion reveals the ticking time bomb beneath our feet, or at least the possibility of one; however improbable or uncommon it may be, the fear of that possibility can transform perceptions and policies, for good or for ill.
In Merrimack Valley, the disaster that unfolded wasn’t a single pipeline explosion, but dozens of smaller explosions throughout the system. After excess pressure was released into a gas main due to human and technical failures, it surged through the network of pipes, service lines, and meters and surfaced through the gas appliances inside people’s homes. Boilers, furnaces, water heaters, stoves, and other ordinary gas appliances suddenly burst into flame (NTSB), revealing just how contingent and interconnected the gas system really is: a mistake on one section of pipe can affect buildings a half-mile away. What may appear to be private and individual when viewed from the perspective of a single household is revealed by disaster to be interdependent.
Last week, I traced how the gas system produces a geography of risk through fracking wells and peaker plants, showing how cheap energy depends on shifting risk across regions, within communities, and through time. This post follows that geography underground and into the distribution pipes that carry gas into our neighborhoods. Risk in this part of the gas system tends to surface in two contrasting forms: explosions and leaks. One is a sudden rupture, the other an accumulating form of exposure. Unlike fracking wells and peaker plants, the distribution system does not concentrate risk around one visible industrial site. Rather, risk is distributed across the network, made to seem ordinary and diffuse until disaster—slow or sudden—pierces the illusion.
The buried risks of cheap heat include not only the fact that gas infrastructure can fail, as all infrastructure can, but the way those failures have been normalized as inevitable side effects of the system’s operation. Leaks, explosions, and everything in between are treated as unfortunate but socially acceptable costs of maintaining gas service, costs that must ultimately be absorbed by someone.
Thresholds of Risk
Though Merrimack was extraordinary in scale, it was not outside the scope of the gas system’s broader safety record. According to PHMSA, the federal agency responsible for monitoring pipeline safety, there have been a total of 12,563 reported “incidents” since 2006. Incidents that are considered to be “reportable” can include leaks, fires, explosions, injuries, fatalities, and/or property damage. In total, the reported incidents over the past two decades have resulted in $10.5 billion in costs (PHMSA). When looking at the frequency of incidents, there doesn’t appear to be much of a change over time: there have been an average of 628 incidents per year over the last 20 years and 621 incidents per year over the last five—essentially the same. This count does not even include incidents caused by an external fire (e.g. a house fire or wildfire).
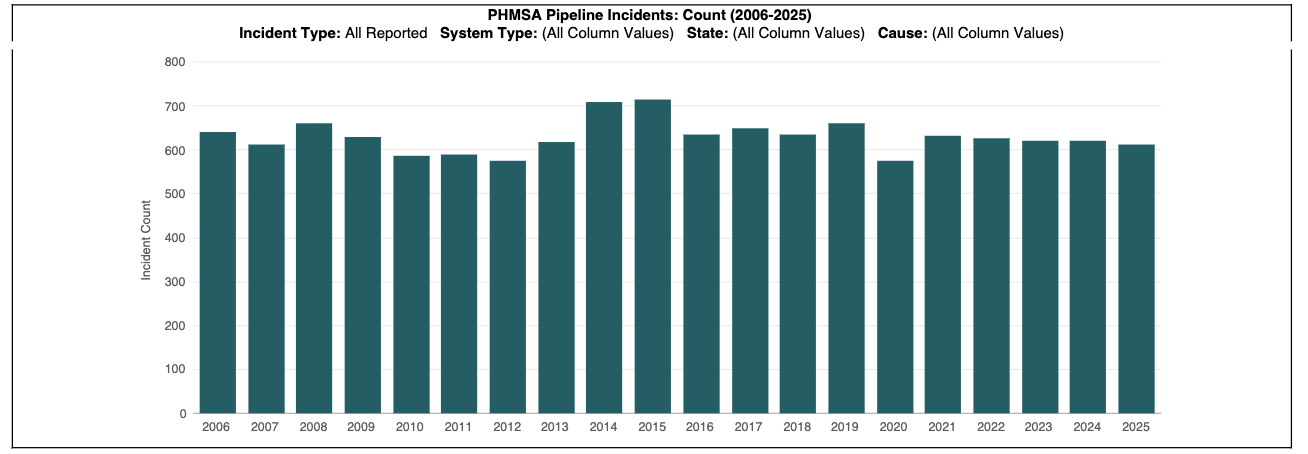
Above: Chart by the Pipeline and Hazardous Materials Safety Administration (PHMSA) of 20-year incident trends on the gas system. To view data, access the PHMSA portal through this link.
The incident dataset only captures system failures that rise to the level of becoming reportable. That threshold, as I discussed in my earlier post on the geography of risk, is both technical and social: what kinds of harm are counted, measured, and treated as unacceptable, and what kinds are “socially acceptable” and for whom? In reality, many failures of the distribution system are neither reported nor recorded. Rather, they are quotidian, background occurrences: leaks that move slowly and disperse as methane escapes from aging mains, service lines, and even our gas appliances, accumulating in our air, our neighborhoods, and our homes long before they are noticed, if they ever are. The point is not that gas disasters happen every day, or that every incident resembles Merrimack Valley in scale and severity, but that these many forms of failure are treated as part of the ordinary cost of maintaining gas service.
Distributing Risk
The fracked gas that doesn’t go to electricity generation goes to heat buildings and fuel industrial processes. Residential and commercial buildings (and some industrial customers) receive this gas through the distribution system, which consists of the smaller-diameter but far more extensive network of pipelines: roughly 2.4 million miles across the U.S. By contrast, the larger-diameter transmission system spans about 400,000 miles. Distribution “main” pipelines then branch off into smaller (in diameter) service lines, which connect individual buildings to the gas system. And at every point along the way of this vast network exists the potential for leakage.
According to PHMSA, pipeline operators reported that they eliminated or repaired 544,736 leaks in the distribution system in 2025, which included 213,919 “hazardous” leaks (2025 annual report). PHMSA generally treats hazardous leaks as those requiring prompt action because they pose an existing or probable future danger to people or property. There were also 108,743 additional known leaks that had reported but not yet been repaired as of the end of 2025. While seemingly a lot of leaks (roughly one leak for every 3.7 miles of service or main distribution pipeline), these figures only capture the leaks that were detected and reported. Countless others remain invisible, unmeasured, or unaccounted for.
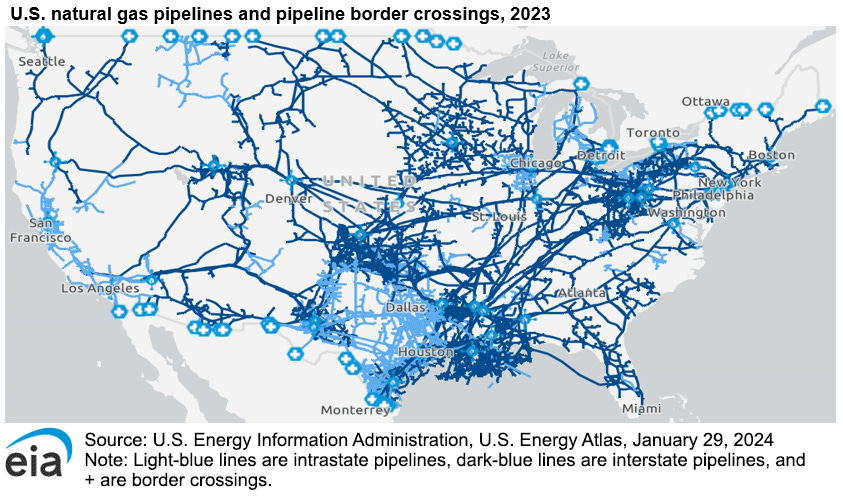
Above: A map of the 400,000 miles of transmission pipelines. Utilities do not have to publicly share maps of their distribution pipelines, so the 2.4 million miles of the distribution network is not shown on this map.
Underestimated Leaks
Gas system leaks are harmful for several reasons. The gas that runs through these pipes is mostly methane (CH4), a powerful climate-damaging gas that is far more potent than carbon dioxide. These leaks also create potential safety risks, as they can contribute to rare but often devastating explosions. Yet leaks are notoriously hard to detect and overall remain underestimated by major reporting authorities like the EPA and PHMSA.
Studies conducted using advanced mobile detection methods (which involve driving around with special equipment to survey emissions from pipeline segments) estimate a far higher prevalence of leaks in the distribution system compared to the EPA’s estimate, with one estimating that its “national methane emissions estimate is approximately 5× greater…than the U.S. Environmental Protection Agency’s current greenhouse gas inventory estimate for pipeline mains in local distribution systems” (Weller et al., 2020) and that there are likely 2.4x more leaks than current inventories report (Weller et al, 2018). This led researchers to estimate that, nationally, there are closer to 659,000 leaks for distribution mains alone (not counting service lines or meters), or about 1 leak for every 2 miles of distribution pipe (Weller and von Fischer, 2021). While this measurement is not apples-to-apples compared to the reported PHMSA leak repairs (due to differing methodologies and the measure of overall prevalence vs. reported repairs), they do further demonstrate that official datasets likely capture only a fraction of the leakage problem.
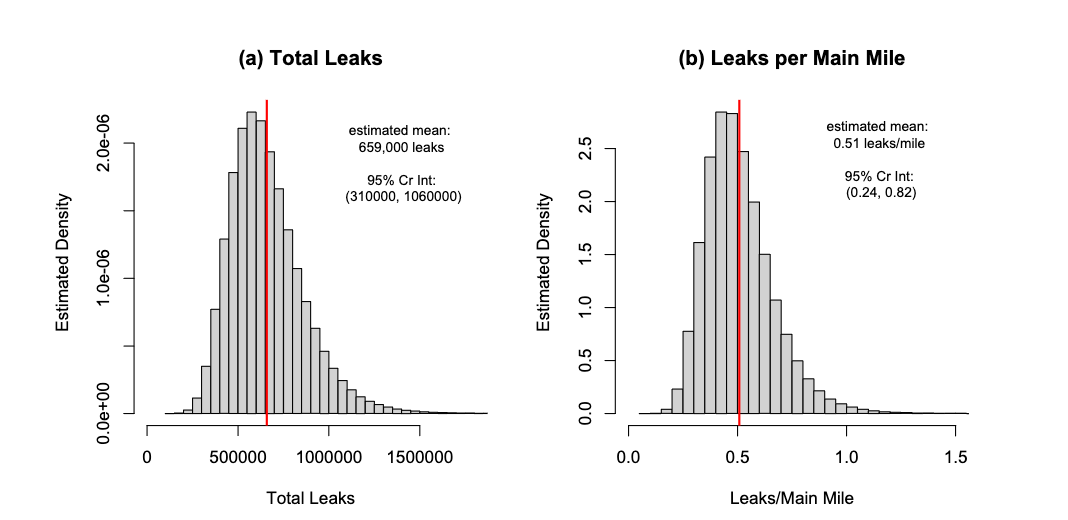
Above: A 2021 study found far more leaks than were reported by pipeline operators, with an average of 1 leak per 2 miles of distribution pipe.
A regional study in Massachusetts using a similar leak detection technique found that researchers detected “1.5 to 3 times as many leaks as utilities report” (HEET). Mapping the location of these leaks has revealed that they tend to be concentrated in disadvantaged communities, where the infrastructure is older and less frequently maintained, or where utilities are slower to fix reported leaks. That uneven geography likely reflects multiple overlapping conditions, including older infrastructure, slower repair timelines, long histories of community disinvestment, and implicit or overt discrimination based on race and class. For example, one study found that methane gas leaks from the distribution network are “more prevalent in neighborhoods with low-income or majority non-white populations than those with high income or predominately white populations” (Weller et al., 2022).
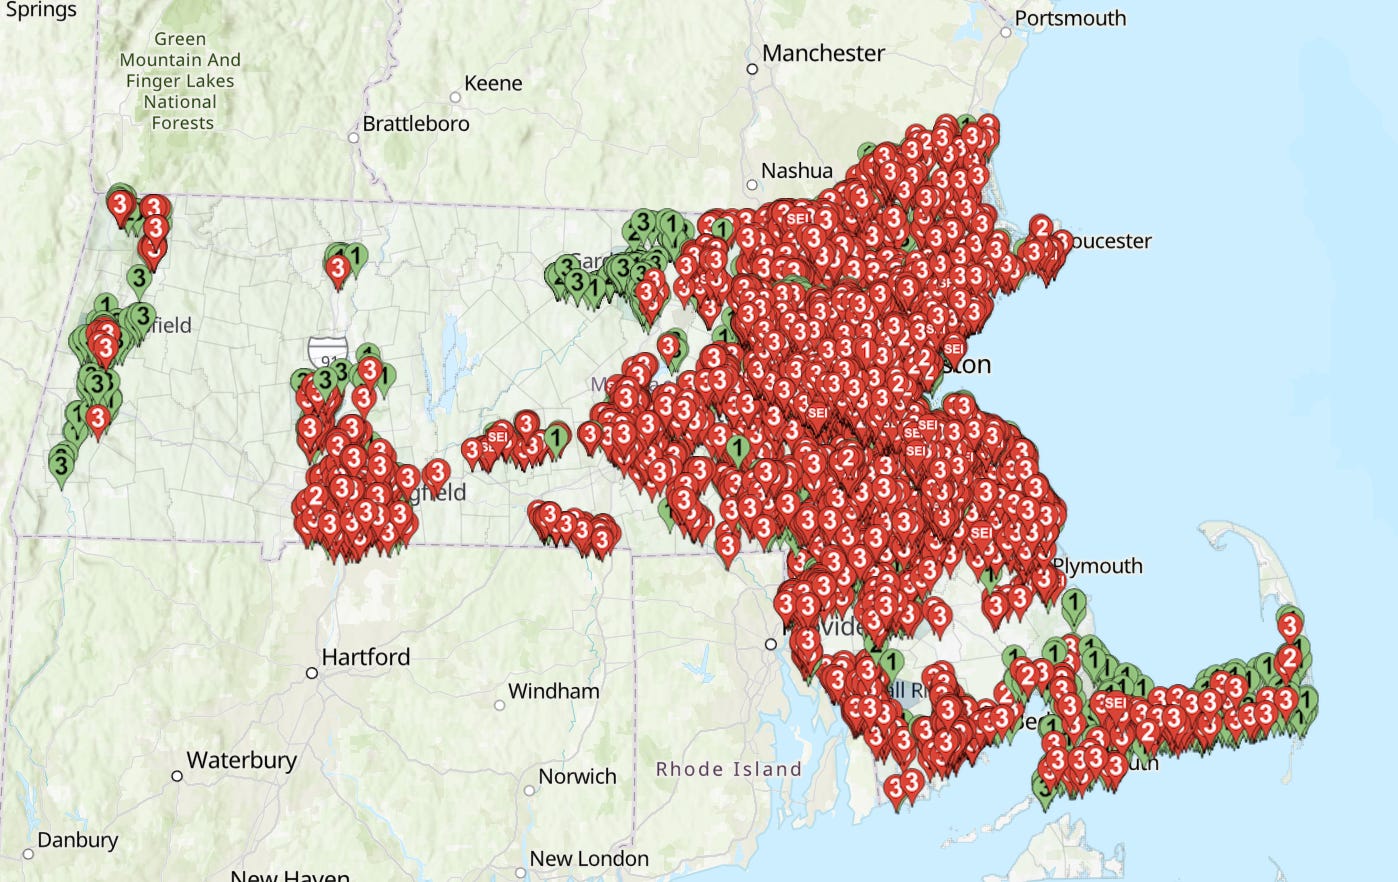
Above: The Gas Leaks Survey map of Massachusetts published by HEET. See the interactive version here.
A leak, then, is not only a technical failure at a particular point in the pipeline. It is also part of a social geography of maintenance and neglect. The “someone” expected to absorb the costs of the system’s failure is not randomly chosen; rather, risk follows older infrastructure, slower repairs, disinvestment, and the racial and class geographies that shape whose neighborhoods are treated as urgent and whose are treated as tolerable. Communities already burdened by poor air quality, higher asthma rates, energy insecurity, aging housing, and fewer resources to demand repairs are more likely to experience gas leaks not as isolated defects, but as yet another layer of environmental risk. And so in neighborhoods shaped by disinvestment, leaks can become ordinary features of the built environment: hazards that linger long enough to be absorbed into daily life, treated as acceptable byproducts of the infrastructure that delivers energy elsewhere.
Merrimack Valley reveals a different but related problem. The 2018 explosions were not caused by an ordinary leak, but by an “overpressurization event” that exposed how interconnected we are by this mostly invisible system and how much gas safety depends on the management of the system and its vulnerability to technical failures and human error. Where leaks show how gas risk can accumulate slowly and unevenly, Merrimack shows what happens when that risk surfaces all at once. In both cases, the system’s failures are treated as unfortunate but “socially acceptable” costs of maintaining “cheap” gas service, producing costs that someone has to absorb. Continuing to rebuild the gas system only reproduces these risks, entrenching communities further in fossil fuel dependency and disaster.
Next week, I’ll finish this mini-series exploring the gas system’s distributed risks by turning to the inside of our homes. This is where the effects of fracking wells, peaker plants, leaking and ruptured pipelines converge. If cheap heat depends on keeping these risks buried, then a cleaner and more affordable future requires more than just repairing and replacing old pipes with new methane gas infrastructure. It requires us to begin replacing it with one that distributes costs, benefits, safety, and comfort more equitably.